
Truflation BLS CPI Forecast and US Monthly Inflation Report - June 2026.
Published 13 Jul, 2026
Economic Growth and Consumer Activity
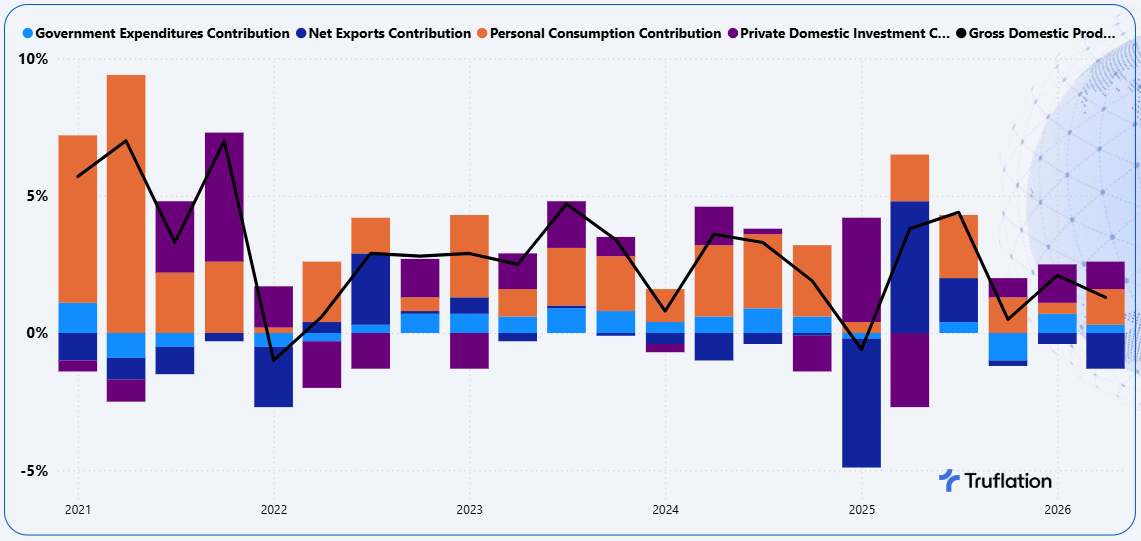
The U.S. economy appears to be losing momentum in the second quarter of 2026. According to the Federal Reserve Bank of Atlanta's GDPNow model, real GDP growth is currently estimated at 1.3% (annualized), down from 2.1% in the first quarter.
The downgrade has been driven primarily by a sharp deterioration in net exports, which are expected to weigh heavily on second quarter growth. Encouragingly, this weakness has been partially offset by stronger personal consumption, highlighting the continued resilience of U.S. households despite mounting economic headwinds.
Exhibit 1 – U.S. GDP Growth and Contributions by Component vs proceeding period
Source: Bureau of Economic Analysis and the Federal Reserve Bank of Atlanta
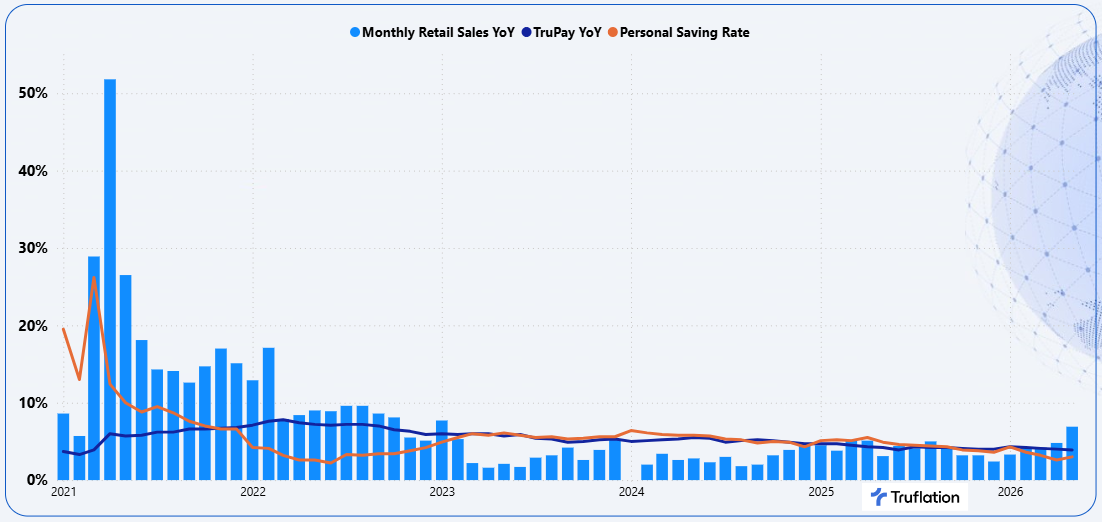
Despite slower economic growth, consumer spending has remained remarkably resilient. According to the U.S. Census Bureau, retail sales increased 6.9% year on year in May, up from 4.8% in April, underscoring stronger than expected consumer demand despite elevated inflation and ongoing global supply chain pressures. Much of this resilience reflects the temporary boost from larger than normal tax refunds distributed during April and May, which lifted disposable incomes. Excluding gasoline stations, retail sales still rose 0.7% month on month, led by strong growth in online retailers and a rebound in motor vehicle sales.
The combination of tax refunds, household tax reductions and a relatively resilient labour market has helped cushion the impact of higher living costs and energy prices. However, this support is likely to prove temporary, raising questions over whether consumer spending can remain as robust once the boost from tax refunds fades.
At the same time, household finances are becoming increasingly stretched. The personal savings rate has fallen to 3.0%, down from 3.5% earlier in the year and well below its 30-year average of 5.7%. Rather than rebuilding financial buffers, many households are drawing down savings simply to cover essential expenses such as groceries, utilities and fuel.
This pressure is increasingly evident in consumer credit data. According to Bankrate's 2026 Emergency Savings Report, 29% of Americans now hold more credit card debt than emergency savings, with Millennials (35%) and Generation X (33%) experiencing the greatest financial strain. By contrast, 52% of Baby Boomers continue to hold emergency savings that exceed their debt. The data highlights a widening financial divide, with higher income households generally able to repay balances each month, while many lower and middle income families are increasingly relying on credit cards and personal loans to maintain their standard of living.
The labour market is also showing signs of cooling. Nonfarm payrolls increased by 57,000 in June, well below market expectations of 115,000 and down from a revised 129,000 in May. Previous months were also revised lower, suggesting employment growth has been weaker than initially reported. Although the unemployment rate edged down to 4.2%, the improvement was driven largely by a decline in labour force participation, which fell to 61.5%, its lowest level since March 2021, as more than 500,000 people exited the workforce.
Employment growth remained concentrated in a handful of sectors, with professional and business services (+36,000), social assistance (+25,000), healthcare (+22,000) and government (+8,000) accounting for most of the gains. In contrast, leisure and hospitality lost 61,000 jobs, disappointing expectations that the FIFA World Cup would provide a meaningful boost to employment.
The ADP private payroll report painted a similar picture, with 98,000 private-sector jobs added during June, below expectations of 110,000 and down from 122,000 in May. Nearly half of all new jobs came from the education and healthcare sectors, while hiring across most other industries remained subdued.
Despite softer hiring, wage growth has remained resilient. Average hourly earnings increased 0.3% month on month and 3.5% year on year, while ADP reported annual wage growth of 4.4% for existing employees and 6.6% for job changers. Income growth therefore continues to modestly outpace inflation, helping to support consumer spending even as household finances come under increasing pressure.
Exhibit 2 – Truflation Pay Growth YoY, Retail Sales Growth YoY and Personal Savings Rate
Source: Truflation, U.S Census Bureau and the Bureau of Economic Analysis
Overall, the latest data suggest the U.S. economy is cooling rather than contracting. Employment growth is slowing, consumer demand remains resilient, and wage growth continues to support household incomes. However, weakening labour force participation, declining savings and growing reliance on consumer credit point to increasing financial strain beneath the surface.
For the Federal Reserve, the data reinforce the case for patience. Slower economic growth and softer labour demand reduce the need for further monetary tightening, while persistent inflation remains the primary policy challenge. Financial markets have largely priced out the prospect of a September rate hike, with Treasury yields falling and equity markets responding positively as investors increasingly expect the Fed to keep policy on hold while monitoring incoming inflation data.
U.S. Trade Deficit Widens
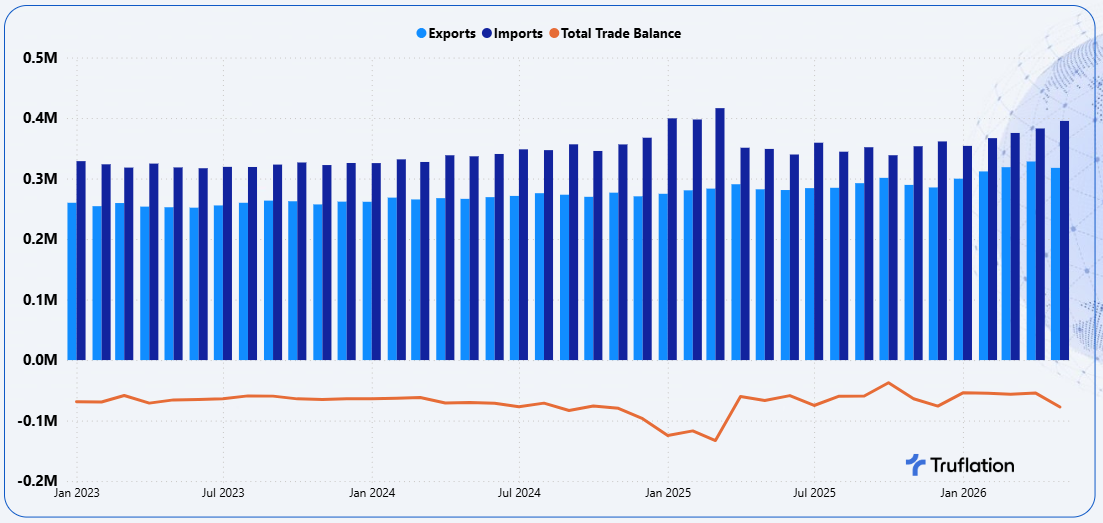
The U.S. trade deficit widened sharply in May, rising 42.2% to $77.6 billion, its largest deficit since March 2025, as imports surged while exports weakened. The widening deficit is the expected drag on second quarter GDP growth.
Imports increased 3.3% to a record $395.3 billion, driven primarily by record capital goods imports as businesses continued investing in artificial intelligence, which remains highly dependent on imports. Consumer goods imports also strengthened as businesses continued to front load inventories ahead of another anticipated round of tariffs.
By contrast, exports fell 3.2% to $317.7 billion, weighed down by the strong U.S. dollar, which reduced the competitiveness of American goods in overseas markets. While exports declined across most major categories, petroleum exports reached a record high as the United States continued to benefit from its position as a net energy exporter.
Exhibit 3 – U.S. Trade Balance, Exports and Imports (Jan 2023 – May 2026)
Source: U.S. Census Bureau, International Trade in Goods and Services
Although the wider trade deficit is expected to weigh on GDP in the near term, the underlying data continue to point to resilient domestic demand. Robust imports of capital equipment reflect ongoing business investment in AI and digital infrastructure, while stronger consumer goods imports suggest household spending remains relatively healthy despite higher prices and slowing economic growth.
Up and Coming Tariffs
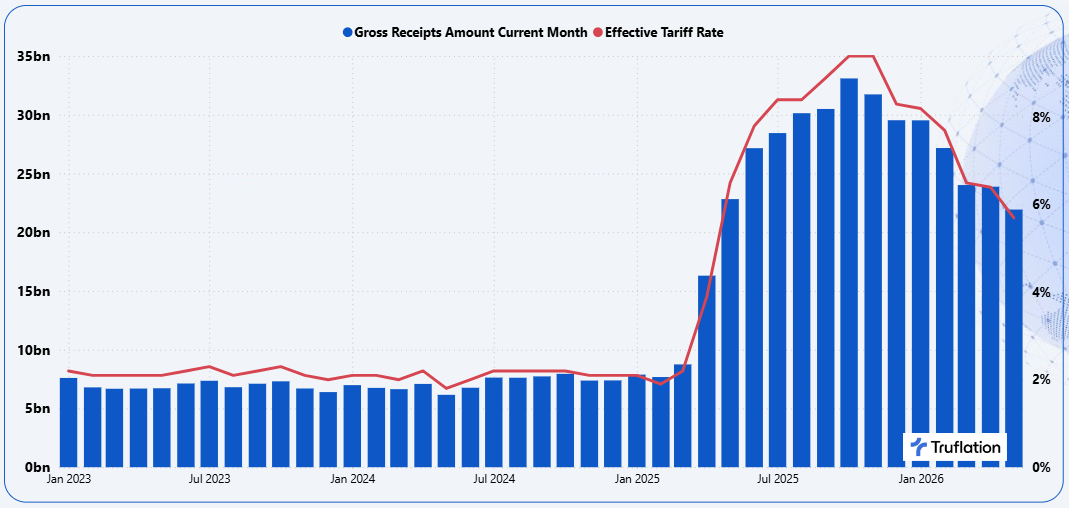
The U.S. Treasury refunded nearly $22 billion in tariff revenues to importers in May following the Supreme Court's decision to overturn the Administration's emergency trade tariffs. This unprecedented wave of repayments effectively erased customs duty collections for the month, pushing net customs revenues below zero for the first time on record.
Prior to the ruling, customs revenues had increased sharply as tariffs were progressively introduced. The effective tariff rate rose from around 2% throughout 2023–24 to a peak of 9.4% in late 2025. Although gross customs receipts remain elevated at $21.9 billion in May 2026, the refund of previously collected duties temporarily reversed much of the government's tariff revenue gains.
Exhibit 4 – U.S. Customs Receipts and Effective Tariff Rate
Source: Department of Treasury
The recent surge in imports also reflects businesses accelerating purchases ahead of another significant shift in U.S. trade policy. With several temporary tariff measures due to expire later this month, firms are continuing to front load inventories to minimise future import costs.
The White House has shifted to alternative legal mechanisms to rebuild its tariff framework, with several key policy changes now underway:
Section 122 Temporary Tariffs: The current 10% universal tariff remains in force until 24 July 2026, when the temporary 150-day authority expires.
New Tariff Regime: Following investigations into 60 trading partners, covering approx. 97–99% of U.S. imports, the Office of the U.S. Trade Representative is finalising a two tier tariff regime:
10% tariffs on imports from 15 economies with recognised forced labour protections, including Canada, Mexico, the UK and the EU.
12.5% tariffs on imports from the remaining 45 economies deemed to have insufficient labour protections.
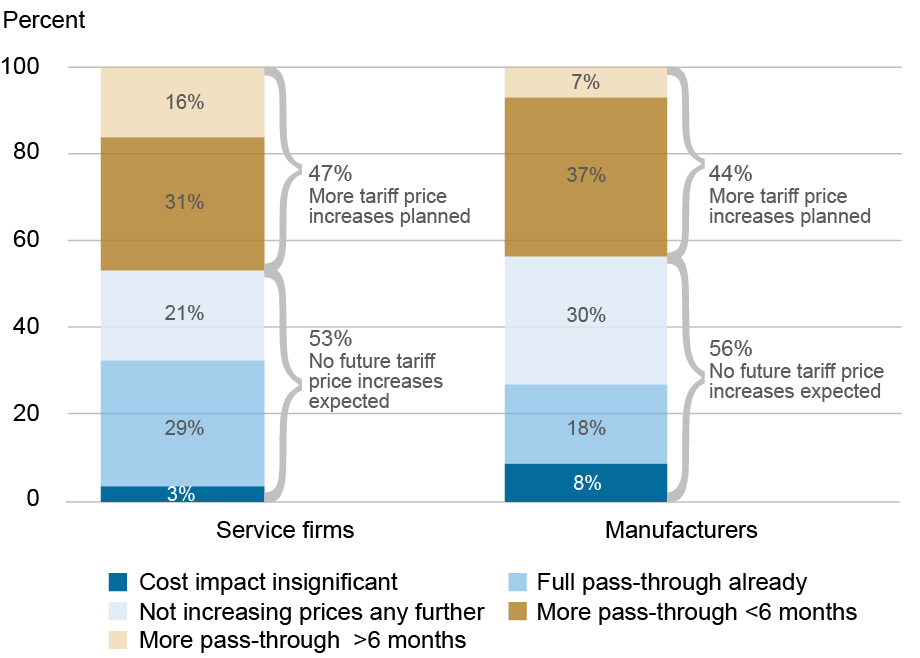
Looking ahead, tariffs are expected to remain an important source of inflationary pressure during the second half of 2026. A recent Federal Reserve Bank of New York survey found that 44% of manufacturers and 47% of service sector firms plan to implement additional tariff related price increases over the next six months to minimise customer resistance, suggesting tariff driven inflation is likely to build progressively rather than emerge as a single sharp increase in consumer prices.
Exhibit 5 – Businesses Expect Further Tariff-Related Price Increases
Source: The Federal Reserve Bank of New York
The greatest consumer price pressures are expected in highly import dependent categories, including:
Toys: Up to 55% price increases.
Apparel and footwear: 35–40% increases.
Glassware, tableware and personal care products: 3–5% increases.
Low-cost imported goods entering through international postal channels.
Taken together, these developments suggest that while headline inflation has recently eased, tariff related price pressures are likely to become increasingly visible throughout the second half of 2026, reinforcing the view that inflation will remain more persistent than is currently anticipated.
Inflation Forecast
Truflation forecasts the U.S. BLS Headline CPI to increase 0.01% month on month and Core CPI to rise 0.26% month on month in June. If realised, this would see headline inflation ease to 3.9% year on year, while core inflation remains elevated at 2.9%, highlighting the continued persistence of underlying price pressures.
Exhibit 6 – BLS CPI Predictions for June
HEADLINE | CORE | |||
YoY | MoM | YoY | MoM | |
Truflation Prediction | +3.9% | +0.01% | +2.9% | +0.26% |
Cleveland Fed Prediction | +3.9% | -0.06% | +2.9% | +0.23% |
Market Consensus | +3.9% |
The expected moderation in headline inflation is being driven primarily by lower energy prices, particularly declines in crude oil and gasoline prices as geopolitical risk premiums continue to unwind. Food inflation has also eased as global supply chains continue to normalise and transportation costs decline. As anticipated, the most volatile components of the CPI basket are now acting as a disinflationary force. Core inflation, however, presents a very different picture.
Exhibit 7 – Truflation YoY Key Inflationary Metrics: Goods vs Services vs Core
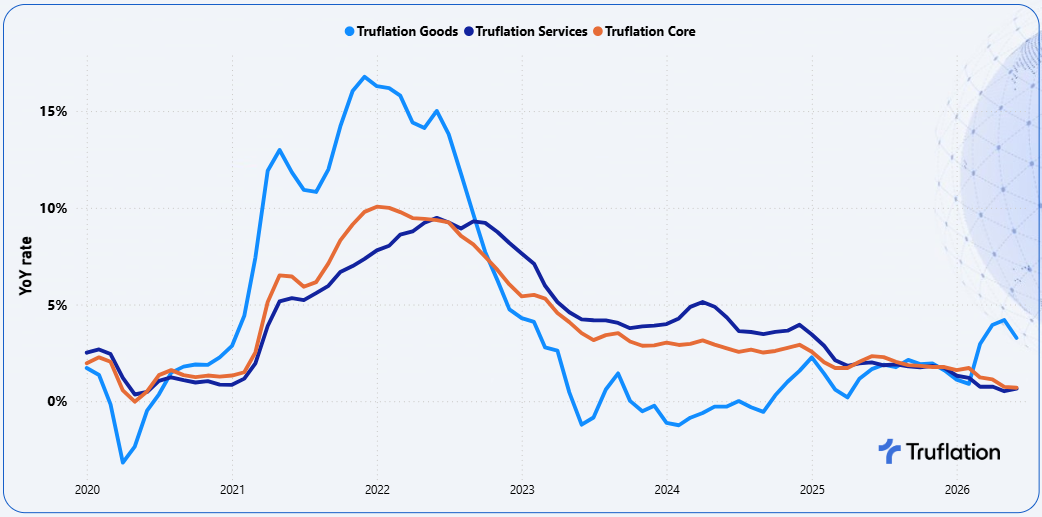
Truflation's Goods Inflation fell 0.7% month on month, reflecting continued improvements in supply chains, healthier inventory levels and increased pricing competition across consumer goods. This moderation is consistent with the latest ISM Manufacturing PMI, where the Prices Paid Index declined 9.1 percentage points to 73.0. While this represents a meaningful easing in cost pressures, the index remains firmly in expansion territory, indicating that input prices continue to rise, albeit at a slower pace.
By contrast, Services Inflation remains considerably more persistent. Truflation's Services Index increased 0.4% month on month, driven by continued price gains across healthcare, education, recreation and housing. Labour costs also remain a key source of inflationary pressure. Although Truflation's U.S. Pay Index continues to point to a gradual moderation in wage growth, earnings remain sufficiently elevated to sustain inflation across labour intensive service industries.
Exhibit 8 – Truflation YoY Category Inflation Drivers
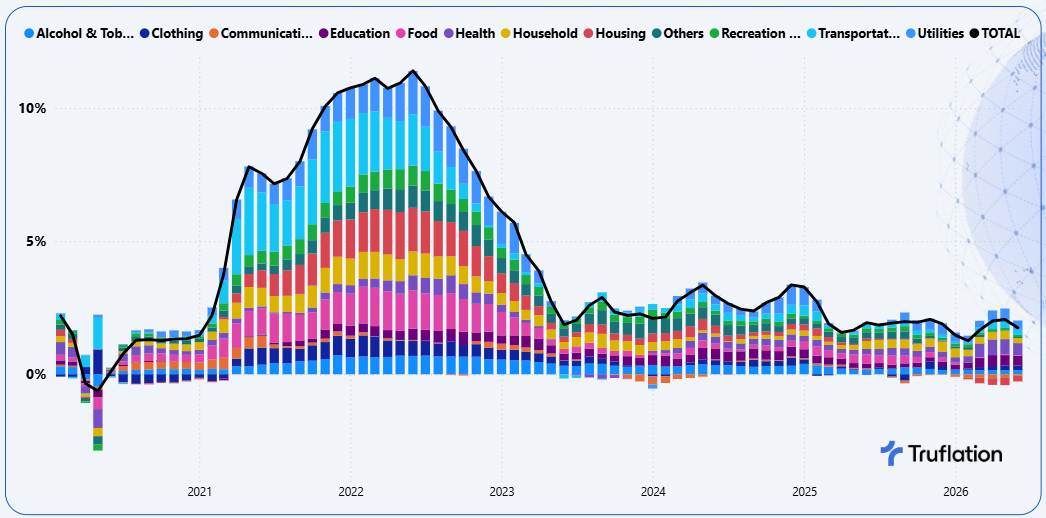
During June, the largest downward contributions to inflation came from Transportation and Food, while Utilities, Communications, Education and Housing generated the strongest upward pressure. The breadth of these service sector price increases reinforces the view that underlying inflation remains broad based and is likely to moderate only gradually over coming months.
Sector-Specific Inflation Drivers
Transportation: -1.1% MoM | +4.5% YoY: Transportation prices declined driven almost entirely by a 7.9% fall in gasoline prices as crude oil prices retreated amid easing geopolitical tensions. Vehicle prices continued to edge higher as manufacturers gradually passed through higher import costs, while public transportation inflation remained elevated as airlines and transit operators continued to face rising labour and operating expenses. Unless global energy markets experience another supply shock, fuel prices are likely to remain the primary source of short term volatility in this category.
Food & Non-Alcoholic Beverages: -0.4% MoM | +0.4% YoY: Food prices declined as lower restaurant prices and stable grocery costs outweighed increases in a handful of supply constrained products. Softer consumer demand has encouraged greater promotional activity across the restaurant sector, while easing fuel and freight costs have reduced distribution expenses throughout the food supply chain. Although categories such as beef and coffee continue to experience supply driven price pressures, improved agricultural conditions elsewhere have kept overall food inflation subdued.
Utilities: +2.2% MoM | +8.2% YoY: Utility prices accelerated sharply as higher electricity and natural gas consumption during the early summer coincided with ongoing increases in infrastructure investment costs. With electricity demand expected to remain structurally strong, upward pressure on utility prices is likely to persist throughout the remainder of the year.
Communications: +1.2% MoM | -1.4% YoY: Driven primarily by higher cellular service prices as major wireless providers reduced promotional discounts and repriced selected plans. Despite this rebound, the communications sector remains structurally deflationary as intense competition, continued 5G deployment and ongoing efficiency improvements continue to lower the effective cost of connectivity.
Education: +0.7% MoM | +8.6% YoY: Education inflation remains one of the strongest contributors to annual price growth. The increase reflects tuition and fee adjustments as colleges and universities continue to pass through higher labour costs, technology investment and reduced public funding. With tuition schedules now largely established, monthly price increases should moderate, although annual education inflation is likely to remain elevated.
Housing: +0.3% MoM | -4.9% YoY: Housing continues to present a mixed inflation picture. While owner occupied housing and rental prices posted modest monthly gains, the annual decline largely reflects the correction from elevated housing prices during 2025 rather than renewed weakness. Short term accommodation remained the strongest performing segment as seasonal travel continued to support hotel occupancy and room rates.
Recreation & Culture: +0.3% MoM | +1.8% YoY: Recreation and culture prices increased modestly as stronger seasonal demand supported spending on entertainment, travel and leisure activities. Service providers continue to face higher labour and operating costs, while improved supply chains and competitive retail markets have kept price growth for recreational goods and consumer electronics relatively subdued. This divergence between services and goods continues to characterise the sector, with experience based spending remaining more resilient than discretionary merchandise. As seasonal travel demand eases later in the year, price growth is expected to moderate unless service sector cost pressures intensify.
Inflation Outlook: Gradual moderation
Inflation is expected to remain sticky over the coming quarter, with headline inflation fluctuating between 3.5% and 4.0% and core inflation remaining around 2.6–2.9%. Several competing forces are likely to shape the inflation outlook.
Disinflationary Forces
Lower crude oil prices continue to weigh on gasoline prices, providing relief to headline inflation.
Goods inflation is moderating as global supply chains normalise and inventories are replenished.
Food inflation has softened as transportation costs decline and agricultural supply conditions improve.
Labour market cooling is reducing the risk of a sustained wage-price spiral, with hiring slowing across most sectors.
Inflationary Forces
Services inflation remains persistent, driven by continued price increases across healthcare, housing, education and recreation.
Wage growth remains resilient at around 3.5–4.5%, continuing to support labour intensive service industries.
Businesses are increasingly passing higher tariff costs through to consumers.
Taken together, these factors suggest that headline inflation is likely to moderate gradually and then remain relatively stable towards the end of the third quarter. Lower energy prices should continue to offset gradually rising tariff related and services inflation, limiting any meaningful decline in underlying price pressures.
Looking beyond the next quarter, inflation risks remain tilted modestly to the upside. While energy prices are expected to stabilise, JPMorgan forecasts Brent crude oil to average between US$80 and US$90 per barrel through the remainder of 2026 before easing in 2027. As the influence of commodity prices fades, inflation is expected to become increasingly driven by domestic factors.
The key themes for the second half of the year include:
Tariff related cost increases gradually feeding through to consumer prices as businesses exhaust lower-cost inventories.
Persistent services inflation, supported by resilient wage growth and structural labour shortages across healthcare, education and housing.
A gradual moderation in consumer demand as excess savings continue to decline and households rely more heavily on consumer credit.
Slower employment growth helping to prevent a renewed acceleration in inflation, although it is unlikely to generate rapid disinflation.
As a result, headline inflation is expected to remain well above the Federal Reserve's 2% target, finishing the year at around 3%. Key risks to this outlook are:
Renewed increases in oil prices resulting from heightened geopolitical tensions.
Faster than expected pass-through of new tariffs into consumer prices.
Stronger household spending supported by resilient wage growth.
Persistent labour shortages across key service industries.
A sharper than expected slowdown in employment and household spending.
Faster normalisation in housing and services inflation.
The outlook continues to support a higher for longer interest rate environment. While headline inflation is easing, the moderation remains gradual and core inflation continues to prove stubborn. At the same time, labour market conditions remain sufficiently resilient to keep policymakers cautious.
Unless inflation surprises materially to the upside or economic activity weakens significantly, the most likely scenario is that the Federal Reserve maintains policy rates through the remainder of 2026, allowing more time to assess whether tariff related price increases prove temporary or become more broadly embedded in underlying inflation.
Summary
Overall, the inflation outlook continues to reflect a two speed economy. Headline inflation is benefiting from lower energy prices, moderating goods inflation and improving supply chains, while core inflation remains considerably more persistent as wage driven pressures continue to support price growth across labour intensive service sectors such as healthcare, housing, education and recreation.
As a result, inflation is unlikely to reaccelerate, but neither is it expected to return quickly to the Federal Reserve's 2% target. Instead, the second half of 2026 is shaping up as a transition period in which energy driven disinflation gradually gives way to more persistent, domestically generated inflation.
This combination of moderating headline inflation and stubborn core price pressures supports the view that inflation will continue to ease only gradually. Consequently, the Federal Reserve is likely to remain patient, maintaining a higher for longer interest rate stance while assessing whether tariff related price increases prove temporary or become more broadly embedded across the economy.
About Truflation
Truflation provides a set of independent inflation indexes drawing on 30+ data partners/sources and more than 15 million product prices across the US. These indexes are released daily, making it one of the most up to date and comprehensive inflation measurement tools in the world. Truflation has been leveraging this measurement tool to predict the BLS CPI number, with a 99.93% accuracy in predicting inflation in the last 12 months.
APPENDIX A
Truflation Category Percentage Change Data
Month-over-Month and Year-over-Year
All Data is based on June 2026
Truflation Categories | MoM% | YoY% |
|
| |
Food & Non-Alcoholic Beverages | -0.4% | +0.4% |
Housing | +0.3% | -4.9% |
Transportation | -1.1% | +4.5% |
Utilities | +2.2% | +8.2% |
Health | +0.0% | +10.5% |
Household Durables & Daily Use Items | -0.0% | +4.5% |
Alcohol & Tobacco | +0.7% | +3.5% |
Clothing & Footwear | +0.0% | +4.3% |
Communications | +1.2% | -1.4% |
Education | +0.7% | +8.6% |
Recreation & Culture | +0.3% | +1.8% |
Other | +0.7% | +0.9% |
Truflation U.S. CPI Headline | +0.0% | +1.8% |
Core | +0.2% | +0.7% |
Goods | -0.7% | +3.3% |
Services | +0.4% | +0.7% |
